
Is regression beta a good measure in valuation?

Having followed financial markets since my undergrad days, I’ve always been fascinated by the art and science of valuation. It is amazing how you can find intrinsic value (i.e., actual worth) of a company and base your investment decision on that.
A little background on my journey and why I have made this blog: The idea that you can find the worth (not price) of a company and decide whether the price justifies buying it or not had piqued my interest. In the pursuit of this knowledge, I have done all the research on internet, read multiple books on fundamental and technical analysis, paid for courses, and what not. I have matured enough now to understand that there’s no single Microsoft Excel ‘template’ that you can get by commenting under someone’s Linkedin post (I had to throw some shade, sorry. Such posts are very annoying!) and you’d be able to value a company or build its financial model.
Long story short, I was introduced to Professor Aswath Damodaran (if you don’t know him, please look him up. He’s the best!) after scrolling thousands of websites trying to teach me the holy grail of becoming the next Warren Buffet, and my entire perspective on investments and valuations changed. I understood that valuation and financial modeling is at least as much, if not more, about the story (assumptions and future expectation about what company will do) as it is about the numbers. This blog is all about documenting my journey of valuing companies because I just enjoy doing it (non-finance people will call me boring, but anyways).
Last semester in one of my postgraduate courses, I valued Riotinto (quite bold of me to try valuing such a giant) using the conventional valuation methods. I got a high distinction in the project and did not look back until very recently. I formally started taking Professor Damodaran’s classes on his YouTube channel and revisited my Riotinto’s model to see the differences between conventional and Prof. Damodaran’s approach.
This post is to discuss one aspect: beta. Beta, in my opinion, is one of the most important inputs of a financial model. If you get it wrong, you’ll probably end up undermining the risks of a business, or even worse, pass on an investment opportunity because you thought it was too risky and overvalued.
The conventional approach to find beta:
Let’s start with how I estimated the beta of Rio previously. It’s simple, I ran a regression between Rio’s stocks daily return and an index’s (ASX 200) daily return. Majority of the analysts do that and the beta you get on the internet is estimated using the same method.
So, what’s wrong with this method when beta, after all, is the risk of a business relative to the risk of market? If you do a quick google search, you’ll find plenty of results saying that beta is the volatility of stock relative to market. I personally disagree with this definition because stock price is usually not an accurate indicator of a company’s intrinsic value. If it were, markets will be efficient and we’d all not be here. Moreover, this definition only talks about the volatility as a risk and not the risks that arise as a result of decisions taken by the company, which is exactly what the conventional approach doesn’t capture. Another reservation I have with this method is complete reliance on historical data to form an expectation for the future.
Although this approach gave me a beta of 1.16, which seems fine given that Rio is a cyclical stock (according to Morningstar), and it would not be incorrect to expect it to move with the market, there is more to beta than just a number.
Rio is a giant and I’d expect it to withstand the period of downturn in the economy (which it has, if you look at its historical financial numbers). Moreover, some special economic conditions (like geopolitical situation disrupting supply chain) will skew the regression results and will never give the correct beta.
What’s the correct method, then?
Forward looking approach for beta:
Prof. Damodaran’s approach resonates with me because it minimizes the risks that come with historical data and focuses more on company itself.
Here’s my beta estimation for Rio:
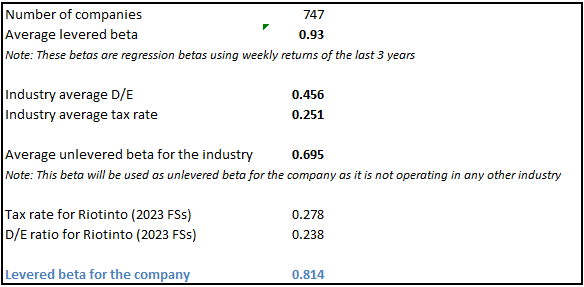
As a starting point, I have used companies that operate in the same industry group and found an industry average beta using weekly returns (got this data from lseg refinitiv workspace so it is really not too much hassle). Then I got industry’s average tax rate and debt-equity ratio to convert the unlevered beta in to levered beta. Finally, I have used Rio’s tax rate and debt-equity ratio to find levered beta for the company.
This approach gives me a beta of 0.81, which still implies that Rio tends to move with the overall market, meaning this business has an element of systematic risk that influences its stock price. However, this approach also puts focus on the capital structure of the company as leverage tends to amplify risk and return. Moreover, if the company were operating in multiple industry groups, we’d have taken a weighted average of those industry groups according to the proportion over overall value Rio drives from each sector. This weighted average ensures that the risk arising from company’s decision to operate in different industry groups is being captured.
Finally, as I argued before, Rio is a giant and I expect it to do just fine during economic downturns, this beta of 0.81 is reflecting that as well.
See how different this approach is to the conventional approach. Although we do not have a huge gap between the two betas, it is the story that matters. I have a thesis about the company, and I have numbers to support my thesis. Without a story behind the numbers, I personally would never be confident in any investment decision I arrive at.
Note: I’ll be writing more on this comparison as I further dissect my initial valuation model of Rio.